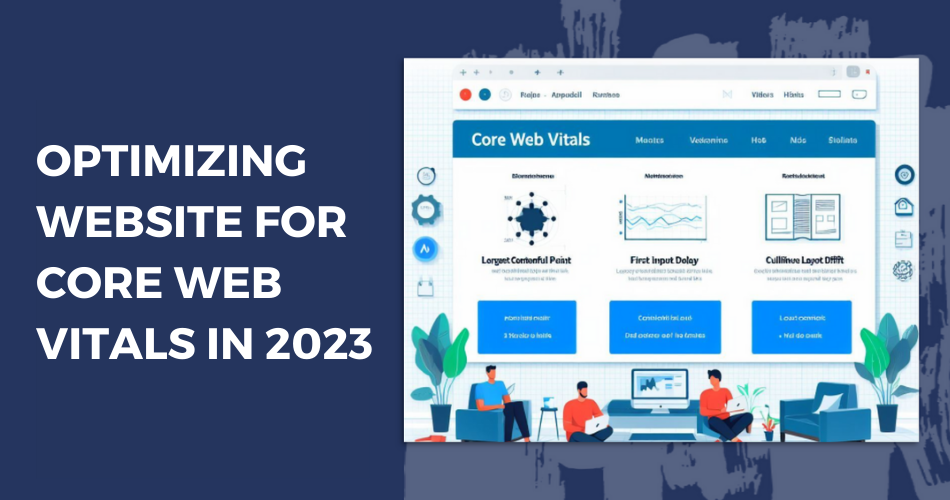
With page experience becoming an increasingly important ranking factor for Google search, optimizing for Core Web Vitals is now imperative for any website looking to improve its user experience and SEO rankings.
Introduced in 2020, Core Web Vitals are a set of 3 key metrics recommended by Google to measure key aspects of page speed and performance that impact conversion rates:
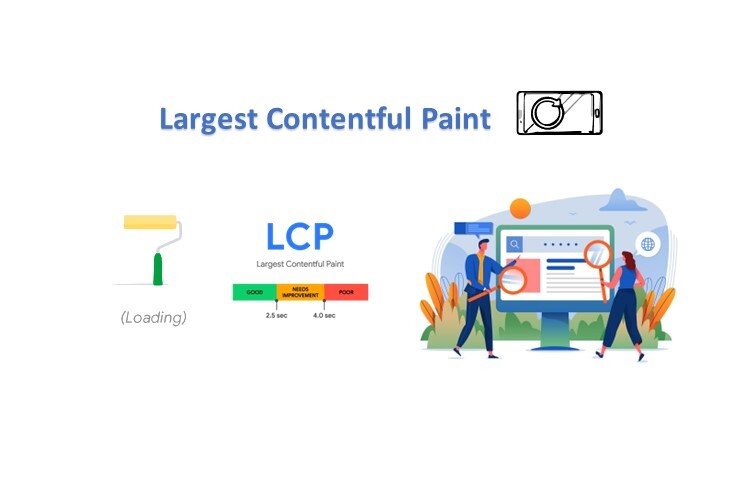
- Largest Contentful Paint (LCP) – Measures load time and renders the main content of the page.
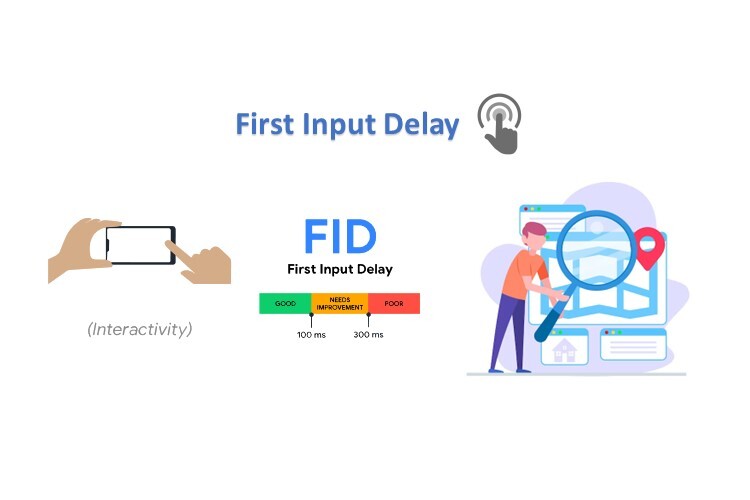
- First Input Delay (FID) – Measures interactivity by quantifying the experience when users first interact with the page.
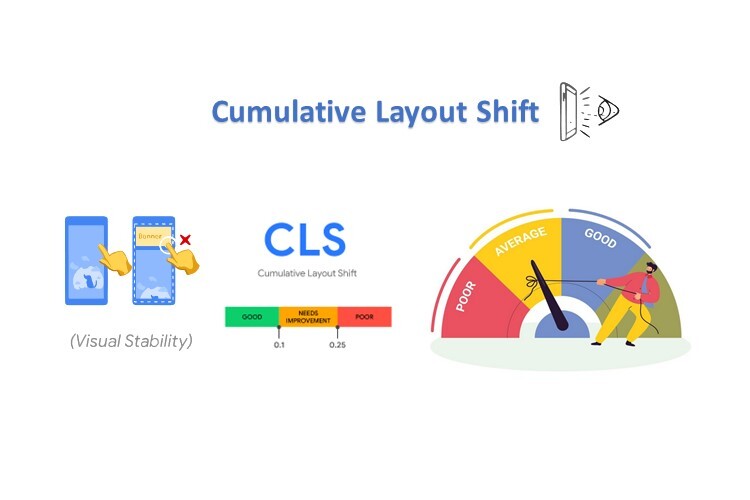
- Cumulative Layout Shift (CLS) – Measures visual stability by quantifying unexpected layout shifts of visible page content.
While Google has set general benchmarks for good page experience, specific thresholds and targets vary based on the type of website and page.
This comprehensive guide will examine proven strategies and techniques to optimize your website for excellence across all 3 Core Web Vitals in 2025.
Table of Contents
I. Why Core Web Vitals Matter for SEO and UX
Delivering a high-quality user experience should be the top priority for any website. With Core Web Vitals, Google has provided a standardized set of metrics and targets to evaluate:
- Page speed
- Site performance
- Overall responsiveness and reliability
On this matter, Gidon Sadovsky, the founder of Overnight Glasses, advises that prioritizing real-world user experience metrics can lead to lasting improvements in both engagement and trust. Businesses should consider performance optimizations not just for search ranking benefits but to enhance customer satisfaction across all interactions
Achieving excellent Core Web Vital scores directly translates into tangible UX and business benefits:
- Faster loading pages keep visitors engaged.
- A responsive experience creates seamless interactions.
- Reliable performance builds user trust.
This leads to higher conversion rates, lower bounce rates, and improved brand loyalty.
On the SEO side, Core Web Vitals act as a Page Experience signal in Google’s search ranking algorithm. Starting in 2021, Google has been rolling out ranking boosts for pages that meet the recommended Core Web Vital thresholds.
Optimizing your website for Core Web Vitals should be a top priority to stay competitive in 2023 and beyond. Let’s examine how to diagnose issues and implement fixes to excel across all 3 metrics.
II. Diagnosing Core Web Vitals Issues
The first step is running detailed audits to surface the root causes behind poor Core Web Vital performance. Here are 4 key tools to utilize:
2.1. Lighthouse Reports
Lighthouse is an automated web performance auditing tool built directly into Google Chrome. It generates detailed reports grading page performance across critical metrics including all 3 Core Web Vitals:
Lighthouse identifies specific opportunities to improve your CWV scores and provides actionable recommendations to implement fixes.
2.2. WebPageTest
WebPageTest provides in-depth analytics on real-world page loading speed through video recordings, content breakdowns, and diagnostic tools like waterfall charts:
These visualizations help identify blocking requests and map the loading sequence of page resources. Slow endpoints degrading TTFB (Time to First Byte) can also be spotted.
2.3. PageSpeed Insights
PageSpeed Insights evaluates both mobile and desktop page loading performance using Google’s own infrastructure. The Lab Data sections provide field data on real-world Core Web Vitals performance.
This helps validate that optimizations are improving real user experience in addition to lab scores.
2.4. Real User Monitoring (RUM)
While the above tools use lab data, RUM captures metrics directly from real user sessions in the field. Software like Google Analytics records actual LCP, FID, and CLS measurements across visits over time:
RUM paints the clearest picture of real-world Core Web Vitals performance on diverse devices, browsers, and networks.
Using a combination of lab tools and RUM provides both expert auditing as well as validation that improvements impact end users.
III. Optimizing Largest Contentful Paint (LCP)

LCP measures when the main page content renders visually complete in the browser. The target is under 2.5 seconds.
Slow LCP is primarily caused by bloated page weight, render-blocking requests, and unoptimized media. Here are 12 techniques to optimize LCP:
#1. Compress Images
Heavy images are often the #1 cause of poor LCP. Enable WebP formats, configure proper dimensions, optimize compression levels, and deliver properly sized responsive images.
#2. Lazy Load Non-Critical Images
Defer offscreen and non-critical images with native lazy loading or a library like Lazysizes. This reduces the initial page payload.
#3. Preload Key Requests
Preload important assets like web fonts, hero images, and critical CSS using <link rel=”preload”>. This accelerates delivery and rendering.
#4. Minify & Bundle Code
Minify HTML, CSS, and JS to reduce unnecessary bytes. Bundling consolidates files and optimizes caching.
#5. Use Content Delivery Networks (CDNs)
CDNs like Cloudflare and Akamai geographically distribute static assets closer to users for faster delivery.
#6. Optimize Web Font Usage
Limit custom web fonts and their file formats. Set proper font-display swap periods. Subset character sets to only needed glyphs.
#7. Eliminate Render Blocking Resources
Defer parsing of non-critical CSS/JS to unblock rendering using techniques like media attributes, async/defer, and code splitting.
#8. Enable Browser Caching
Set future cache lifetimes for static assets in headers (max-age) and via service workers to minimize requests.
#9. Avoid Redirect Chains
Reduce unnecessary redirects which incur additional round trips before first paint.
#10. Prioritize Early Critical Requests
Frontload delivery of the minimal code/assets needed for the critical rendering path.
#11. Optimize Third Party Embeds
Lazy load non-essential embeds like video players, social media, and ads. Follow best practices for performance-friendly embedding.
#12. Use PRPL Pattern
The PRPL pattern pushes critical resources first, then renders the initial route, precaches remaining assets, and lazy loads non-critical content. Additionally, specialists from Netcorp Software Development Company advise that implementing a mobile-first design approach and utilizing CSS Grid for responsive layouts can significantly enhance LCP performance. In their experience, replacing JavaScript-based carousels with CSS alternatives and employing lazy loading for images have led to measurable improvements in page load times and overall user experience.
IV. Optimizing First Input Delay (FID)

FID measures the delay when users first attempt interacting with a page. The target is under 100ms.
High FID is commonly caused by excessive main thread work, network delays, and legacy JavaScript. Fixes include:
- Code splitting to avoid large bundles
- Minification to reduce parsing/compilation overhead
- Tree shaking to eliminate unused code
- Async loading of non-critical JS
- Optimized caching and prefetching to accelerate delivery
- Prioritizing visible content to be interactive faster
- Using modern ES6+ JavaScript syntax and best practices
- Simplifying animations and transitions that block the thread
- Debouncing scroll/input handlers
- Avoiding legacy frameworks with high overhead like jQuery
- Request prioritization and HTTP/2 multiplexing
- Server-side optimization including edge caching
Implementing these strategies will significantly improve time-to-interactive on both mobile and desktop.
V. Optimizing Cumulative Layout Shift (CLS)

CLS measures the visual stability of a page based on unexpected layout shifts of visible content. The target is under 0.1.
High CLS is often caused by:
- Images/ads loading in after initial render
- Web fonts causing text reflows
- Dynamically injected content
- UI elements changing position across page loads
Here are techniques to minimize layout shifts:
- Placeholder elements reserving space for deferred embeds and images
- Lazy loading offscreen images/iframes
- Setting font styles early and using font-display
- Avoiding “pop-in” animations and transitions
- Consistent DOM ordering and element dimensions
- Avoiding content jumps from scroll handlers
- Intelligent prefetching/preloading of resources
- JavaScript executed post-onload vs mid-page render
- Identical server and client templates
Follow these best practices for a smooth, stable page layout and minimal CLS.
VI. Tracking and Maintaining Core Web Vitals Improvements
Once optimizations are implemented, it’s critical to validate improvements through continuous tracking across both lab and field data.
Set up real user monitoring through Google Analytics. Establish a project dashboard to monitor trends for all 3 metrics versus targets over time.
Conduct weekly synthetic tests through tools like Lighthouse and WebPageTest to prevent performance regressions. Set regression thresholds that trigger alerts.
Make Core Web Vitals a priority across teams from development to content. Provide training on web performance best practices and foster a culture focused on delivering excellent user and business metrics.
Maintain focus through an ongoing technical roadmap, regular diagnostic audits, and iteration on improvements – don’t abandon efforts after launch!
VII. Conclusion
Optimizing for Core Web Vitals should be top priority for WordPress development companies and sites looking to improve user experience and search visibility in 2025.
By following the proven techniques in this guide, your website will achieve excellent LCP, FID, and CLS scores, delivering faster loading, responsive interactivity, and visual stability for visitors.
WordPress development services should focus on diagnosing performance bottlenecks, implementing targeted optimizations across assets, code, and delivery, and sustaining improvements through an ingrained culture of web performance.
Use Core Web Vitals as your north star to guide web performance efforts. Track metrics in Google Analytics and run weekly synthetic tests to prevent regressions.
Make Core Web Vitals a priority across teams from development to content. Provide training on web performance best practices and foster a culture focused on delivering excellent user and business metrics.
Maintain focus through an ongoing technical roadmap, regular diagnostic audits, and iteration on improvements. Don’t abandon efforts after launch!
By making Core Web Vitals central to your WordPress development strategy, your users and bottom line will thank you!


![[SALE OFF] Discount 30% All Premium Extensions On Christmas And New Year 2025 christmas-and-new-year-2025](https://landofcoder.b-cdn.net/wp-content/uploads/2024/12/christmas-and-new-year-2025-1-218x150.png)


